I recently started using Ubiquiti’s EdgeRouter Lite to replace the routing functionality of my Airport Extreme at home and for some other networking projects. I really like this little box, $99 gets you a 3-port gigabit router and it can really churn through packets. It runs EdgeOS, which is based upon Debian along with the Vyatta routing stack.
EdgeOS provides a nice web UI as well as a cli shell for editing the configuration. If you’ve never used Vyatta, its configuration and cli look and feel are just like Juniper’s JunOS. Like JunOS, you can also get into a system OS bash shell.
I did some poking around and discovered that the router has 2 GB of flash storage (via USB thumb drive internally) and ordinary Debian packages can be installed. Further, once inside a bash shell there is a command-line interface to manipulate the running Vyatta router configuration. This made me wonder, can I run Chef on this thing to manage it?
Historically doing any sort of scripted management on a router has been a giant pain in the ass, either involving remote expect scripts or XML APIs, because there’s no way to run software directly on the router. Chef expects to run locally on a system and be able to run commands to converge the system to the desired state. If you try to bolt Chef onto a Cisco IOS router for example, you’d at the very least need some sort of proxy layer that takes Chef resources and translates those into IOS commands and runs them remotely. It’s hacky and ugly, I wouldn’t want to run it in production. With an EdgeRouter, its 2 GB of storage and Debian underpinnings, Chef can indeed run directly on the router eliminating the need for any sort of proxy layer!
The EdgeRouter has a Cavium 64-bit MIPS CPU so the standard omnibus Chef client packages won’t work because they’re intended for i686/x86_64. However Chef can be installed from RubyGems. This is the same way I install Chef on Raspberry Pis running Raspbian (which is ARM-based, a/k/a armv6l), and in fact the same knife bootstrap script I used for Raspbian worked for EdgeOS.
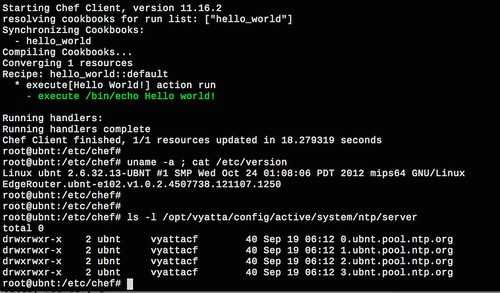
Bootstrapping takes a fresh EdgeOS router and installs Chef on it via ssh from another system. RubyGem packages are installed, Ohai and Chef client gems are installed, and the Chef client.rb and validation key are copied over. Once this is done, Chef can be ran directly on the router.
Bootstrapping EdgeOS
I’ve uploaded my knife bootstrap template to GitHub (https://github.com/bwann/chef/tree/master/knife). Drop this into your ~/.chef/bootstrap directory, then feed it to knife with the -d option. By default the username/password for EdgeOS is ‘ubnt‘ and ‘ubnt‘.
Bootstrapping takes several minutes to run, with installing and updating gems taking 100% of a core for a while. Various things are fetched remotely from the internet with this template, such as Debian package updates and RubyGems.
Using Chef
I’ve only just started using Chef on EdgeOS and so far haven’t gotten to manipulating the Vyatta configuration. I imagine this will involve writing providers to handle running commands via shell. This is tricky because there are some config files (e.g. /etc/snmp/snmpd.conf, zebra) that are managed by EdgeOS and changes to them would be overwritten, therefore they’d have to be managed via Vyatta API. There’s documentation for the Vyatta shell API on the unofficial Vyatta wiki: http://www.vyattawiki.net/wiki/Cli-shell-api. Once I figure this out I’ll write up more about it.
In the meantime I’ve used chef to do things like this:
Install packages, e.g. iftop
Manage OpenSSL certificates for my private CA
Install OpenTSDB tcollectors for system data collection, e.g. CPU/memory/interface counters
Example ohai output
Ohai reports the platform/platform_family as debian/debian, so there’s no clear distinction here that we’re running on a router. So far my way around this in recipes has been keying on node['os_version'].end_with('UBNT').
A few other people have been hacking on EdgeRouters, even getting FreeBSD running on them. I was most surprised by internal flash storage being just a removable USB thumb drive sitting in a socket on the board. It has a 2 GB stick in it, which should easily be replaceable by something larger if so desired. The U-Boot bootloader is over in another piece of flash on the board.
tcollectors work just fine running on the EdgeRouter. I’m using them to collect counters every 15 seconds and push to TSD. There doesn’t seem to be any noticeable CPU lag when the Chef client or tcollectors do their thing. All network interfaces show up to the kernel, so all three ethernet ports, VPN tunnels, and IPv4-IPv6 tunnels can be measured.
Here’s an example of charting bytes in/out (red, green, left axis) of my DSL connection and CPU idle (blue, right axis):
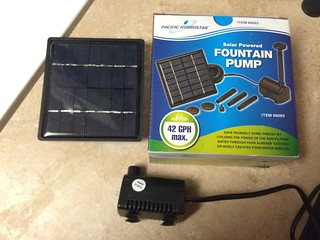
I finally reached a critical mass of various plants, flowers, and succulents on my apartment balcony that required multiple trips to the sink when I needed to water them. While browsing the hardware store I was eyeing the garden drip irrigation systems and thought why not? Originally I wanted to use some sort of a jug which I could fill with water from the bathtub and then gravity feed out to my plants. I didn’t find anything off-the-shelf I could use and shelved the idea. Later I was at Harbor Freight and picked up a cheap 12V submersible pump with the intent to make a little fountain for the garden. I apparently got a defective panel because the one included didn’t do anything when I plugged in the pump. Fortunately I was going to hook the pump to my existing balcony setup anyways, so no loss.
Eventually the idea came to me to use a Tidy Cat litter jug and this submersible pump to water my flowers. I go through litter every few weeks and the jugs are sturdy plastic with a hinged lid and handle, and designed to hold 38 pounds of clay, so perfect for lugging water outside. I took the pump to the hardware store and found that its outlet slipped perfectly into 1/2″ garden sprinkler tubing. I had no idea how I’d wind up using it so I settled on using a 1/2″ tubing to connect the pump to a tee up outside of the jug. From there it split off to feed a pair of manifolds, which broke out into 1/4″ connectors for feed lines. When I want to refill the jugs, I lift the tube out and take the pump out, leaving it behind.
Each flowerpot has a 1 gallon per hour drip fitting and the planters have 2-3 drip fittings. There’s plenty of pressure to push water along, even with 1/4″ tubing going upwards. However, it’s not automated at all at this point. I still have to plug in the motor for several minutes to water the plants, which still beats going back and forth to the sink. I do have an OpenSprinkler controller I bought at Maker Faire that I’ll likely try next. This will let me automate watering and maybe not have to think about it. My plants have shown an amazing comeback after getting good watering!
I’ve been late to the game of nerding out on the telephone network and phreaking in general and it’s been fun browsing over old maps. I was browsing the “Central section” microwave map on the AT&T Long Lines Places and Routes website and was surprised to see my home town, Kinta, on the map. I grew up with a tall microwave tower on top of what we know as Beaver Mountain a few miles north of Kinta. I sort of knew it was owned by AT&T (now SBC, now at&t), but I had no idea until now it was part of the fabled AT&T Long Lines division. I also frequently passed the tower at Krebs on the way to McAlester, as it was just off highway 31. From looking at the larger map, it appears both were part of a microwave relay link between St Louis, MO and Fort Worth, TX.
The microwave horns and what not were stripped some time ago on the tower on Beaver Mountain, it’s just sort of standing there now. The tower at Krebs was also stripped of it’s microwave kit and was replaced by various random antenna.
The Internet seems pretty sparse with information about either of these two towers, I’m curious to know if there’s more about them anywhere. The map I found was dated October 1966, so presumably they were in service then, but I have no idea when they were decommissioned. They’d make awesome observation decks!
Edit (Feb 2018): According to FCC Antenna Structure Registration (#1010196), the tower now belongs to “Communication Enhancement”, as site #20031. It stands at 263′ tall.
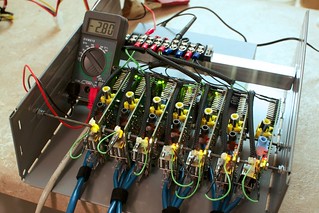
Over a recent couple of weekends I built a thing to measure the current and voltage of the components of a 12V solar/PV power system. Ever since I started using solar power at Burning Man I wanted to get a good measure of how much I was consuming and how much was left. At the time I settled on a Morningstar charge controller with LCD voltage meters to tell me.
This new setup adds data recording+logging into the mix, something I’ve always wanted. Here, the measurement modules are attached to a Raspberry Pi via i2c and a simple python script collects the data and sends it wirelessly to OpenTSDB for storage and charting.
The hardware and other bits, excluding the Pi, ran me around $50-$60. Allegedly this setup should handle about 3 amps, although if somebody wants to do the arithmetic and make an appropriate shunt they should be able to measure much higher currents.
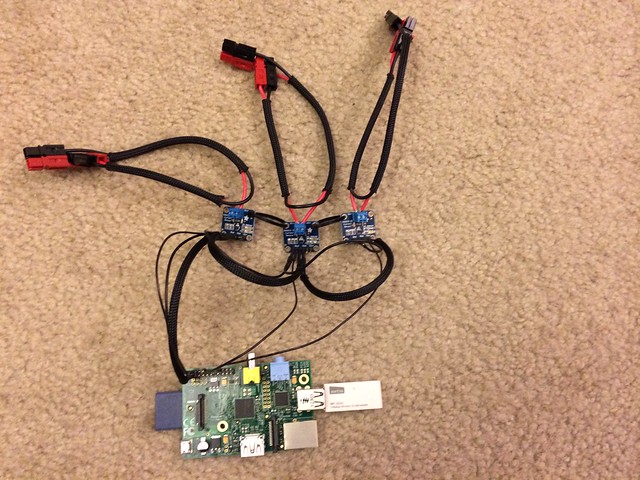
At the heart of the setup are three INA219 (“high side DC current sensor”) modules from Adafruit which do the measuring, one each for the solar input, the battery, and load. They’re about 1″ square, have a terminal on the board for wiring in-line in electrical circuits to measure, and have a small shunt and chip that measures the voltage and current. The bulk of my time was spent making a wiring harness for this setup to plug into my existing solar setup and soldering on all the connectors. I personally insist on everything I have use Power Pole connectors so if one were less inclined they could avoid a lot of work. Working with the rest was relatively quick work. Adafruit has some excellent tutorials on wiring up and working with the INA219, which is where I got the majority of my information.
Each of the INA219 modules speak i2c to the RPi and the SDA/SCL pins daisy-chained with continuous jumpers back to the respective i2c pins on the RPi (P3 and P5) to form an i2c bus. Two have solder junctions to set the i2c address, resulting in the three being accessible on the bus at 0x40, 0x41, and 0x44. Also to power the INA modules themselves, another set of continuous jumpers connect Vcc and GND back to the 5v and GND pins of the Raspberry Pi. Adafruit has a generous tutorial on how to connect and verify i2c is working. For the most part it was painless and simple, enable the i2c kernel module and the three INA modules just showed up when I ran “i2cdetect -y 1”.
The few software libraries for the INA219 and i2c assume use with an Arduino, but some dude over on Github did a nice Python port of the INA219/i2c library. However, there looks to have been a bug in the original Arduino version regarding two’s complements and the code on Github needs a slight patch to properly measure negative voltages. (note to self, submit a patch). Once that’s sorted out, it’s just simple Python method calls to get instant voltage and current information.
A quick example to query the three INA219 modules looks like:
To get the voltage of the thing you’re measuring, you must add the bus voltage and shunt voltage to get all the components of the measurement. Also, you must wire grounds of the battery, solar panel, load, and the Raspberry Pi together to be able to measure individual voltages. (Something I forgot to realize for a long time.) Otherwise you only get electrical current data, voltage is indeterminate.
root@solar:/home/pi# python power.py
== 0x40
Bus voltage:   12.420 V
Shunt voltage: -37.270 mV
Current:       -373.000 mA
Voltage:       12.383 V
== 0x41
Bus voltage:   12.548 V
Shunt voltage: -37.160 mV
Current:       -372.000 mA
Voltage:       12.511 V
== 0x44
Bus voltage:   12.416 V
Shunt voltage: 1.000 mV
Current:       10.000 mA
Voltage:       12.417 V
Here, module 0x40 is represents the load, 0x41 is the battery, and 0x44 are the solar panel. There’s a string of 12V LED lights hooked up right now, drawing 373 milliamps. Likewise there’s a 373 mA draw on the battery. The solar panel is in shade so it’s only contributing 10 mA right now. The negative values are a handy indicator of the direction of the current, i.e. when the battery is charging the values are positive, when it’s being discharged the values are negative.
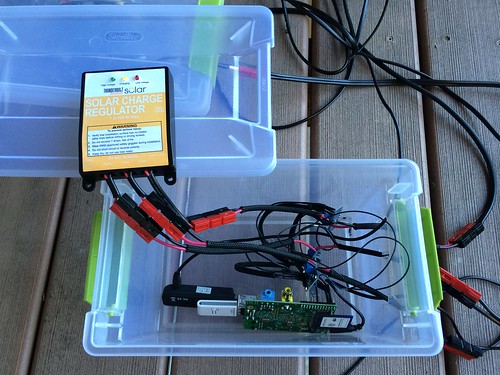
For the small solar setup, I’m using a solar panel and charge controller from Harbor Freight. Their 7A charge controller features a low voltage disconnect (something I required for this setup), is compact and pretty inexpensive. It fits tidily into the plastic container which temporarily houses the RPi and modules. This will work with any charge controller. Another container holds a small 12V battery. [Edit: I have my doubts about the LVD feature of this charge controller after it apparently let my battery get down to 6 VDC under load overnight. >:( ]
Note: at the time the Raspberry Pi is not solar/battery powered, nor can it switch on/off any of the loads. I have an USB power cord running inside to power the setup. It should be easy to rig up a voltage converter, but that’s a project for another time. This would make it a real standalone unit and be quite handy and adapted into other real applications.
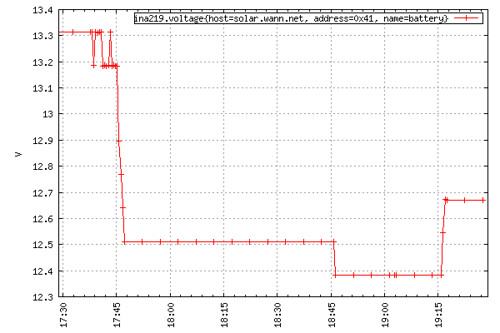
For the data storage, I wrote a Python tcollector script for OpenTSDB which polls the INA modules every 15 seconds and records the values to a database. Using the built-in plotting tools, I can quickly visualize current or historic solar production or power consumption. The shameless cut-n-paste tcollector I wrote is over on my Github page.
The script prints a ‘ina219’-prefixed metric name, timestamp, tags and data suitable for use in a time series database:
Yes! Web-scale home electricity tracking, because why not!
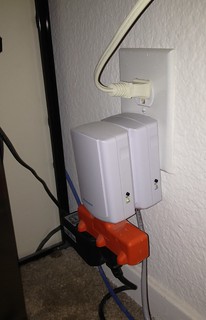
For the longest time I’ve been using the Kill-A-Watt meter to measure home power usage, especially all of my computer gear. The problem is, you only get a LCD readout, no way to store that info over time. A friend told me how he was using Insteon (basically X10 home automation that doesn’t suck) kit at home and they had an iMeter device that would collect power usage which you could download via an Ethernet-based Insteon SmartLinc controller. Each iMeter cost about $35 and the 2412N controller was about $90. Spendy if you want to measure just one thing, but it’s certainly way cheaper than any of the alternatives. I bought a set to put on my desktop computers and IKEA cluster.
Insteon iMeter and 2412N controller
The Insteon controller has a web server built into it with a basic but functional interface; same for the iPhone app. The client lets you control various Insteon devices or display the watt reading from a single iMeter. Unfortunately the 2412N controller I have doesn’t store values it collects. After examining the JavaScript the web UI uses and some tcpdumps, I was able to pick apart the commands the client makes over HTTP to get data from the meters. Each Insteon device has a six-digit hex ID such as 19.84.17 written on the back, which in the case of multiple iMeters is used to reference a particular one.
A request is made to the controller with a GET request with a request string like /3?02621984170F8200=I=3, then another request for /buffstatus.xml fetches the result of the request. In this case:
0262 is basically “here comes a raw command”
198417 is the ID of the iMeter
82 is “get iMeter status”
00 is a do not care byte, and the rest is trailing info.
Given the Insteon IDs of each iMeter, it’s possible to fetch the wattage readings from them via HTTP. Here is an Insteon developer PDF that describe the various request and response fields.
A command-line example:
[bwann@lapdance ~]$ GET http://smartlinc01/3?02621984170F8200=I=3 ; GET http://smartlinc01/buffstatus.xml
<response><BS>02621988140F82000602501988141E50C42B820002511988141E50C41B820000D201050180009A00097D207DD5</BS></response>
The response is a long string of text fields that contain various things as the remote device id, command sent, low+high bytes for counters of current and total watts used.
I incorporated this into a small python script to handle all the munging and parsing for me. (‘GET‘, by the way, along with ‘POST‘ and ‘HEAD‘ are part of the perl-libwww-perl package and is awesome when you want to quickly run a particular HTTP command without typing it out by hand in telnet).
For the TL;DR of the python code, head over to GitHub where I’ve implemented iMeter collection into a database collection script: smartlinc_imeter.py
Great, now how to collect and graph it?
OpenTSDB
All this year I’ve been playing with the OpenTSDB time series database (which you should really check out) at home to gather server statistics and really love how trivial it makes adding and collecting new metrics. Come up with a string of value+timestamp+counter and optional key=value tags, shoot it over to a TCP socket, and you’re done. Plug in the same metric name into the TSD web interface, and boom, there’s your charts. Way, way, way better than the old song and dance of RRD and whipping up the ubiquitous not-so-simple shell script to store+graph just one damn metric. (Okay, it is a bit more complicated to get started with than that in that now you’re running HBase as the backend, but it’s designed to handle billions of data points a day, it’s easy to get started with and totally worth it. Very fast means it’s a pleasure to work with your datasets. The awesomeness of OpenTSDB is a whole ‘nother post.)
OpenTSDB uses a set of simple tcollector scripts that run on systems and upload various data such as cpu/disk/io usage, and whatnot every 15 seconds. The set of tcollector scripts that come with OpenTSDB on GitHub are actually very well written and simple. Because you can send data to TSD over a TCP request it makes collectors very easy to implement. Even one line shell scripts such as “echo blah | nc 4242” work just fine. It lends itself to rapidly letting you invent new collectors to get new metrics you’re interested in. If you’ve ever used Nagios or MRTG, you’ve surely experienced plug-in hell where somebody has gobbed together 50 lines of perl to ultimately run a single command with system() to get one value. Another nice benefit of the tcollector setup, it automatically re-starts a collector script if one dies or you add a new one, something you normally have to deal with on your own.
I wrote a tcollector script in python that would query the Insteon SmartLinc controller every 15 seconds and request data on the various iMeters in my apartment, parse the results, and then upload the values to TSD. I have two metric names insteon.imeter.watt and insteon.imeter.total, tagged with the device ID. Using this I can now generate charts that refresh every 15 seconds to show me the latest power usage! If I ever add another iMeter or other controllers, I just drop in one line into a config file with the new device ID/IP and it automatically picks it up and the data are immediately available in the chart UI.
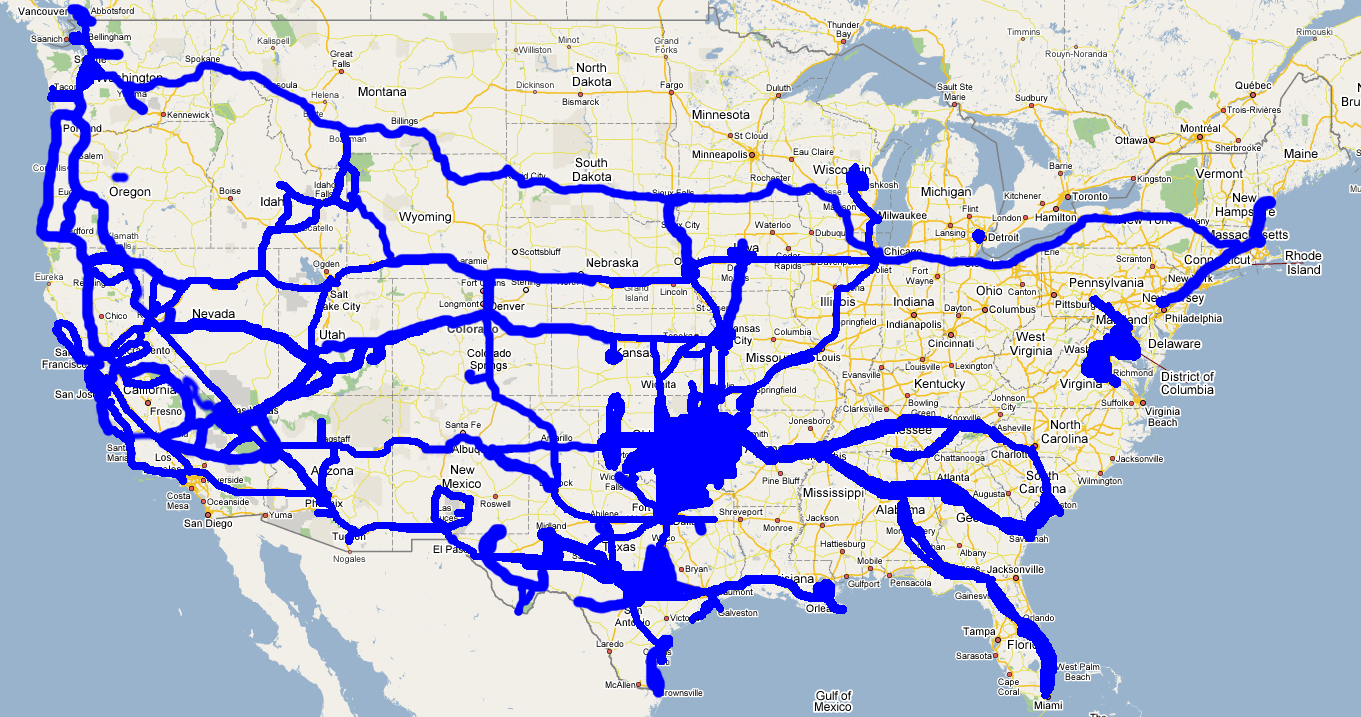
I decided to go to Death Valley for a week to unplug and stayed at the Furnace Creek Ranch. People always wonder why I go out there instead of head off to the beach, and while I love laying on the beach too, sometimes it’s nice to go where it’s dead quiet. In some ways it’s sort of like trekking to the middle of nowhere to Burning Man, except in DV you have the option of staying at hotels. (Las Vegas is 2 hours from DV) Having said it’s quiet, right now is actually the biggest tourist season of the year since the weather is mild, but DV is a huge place and everyone returns to camp/hotel/RV at night. At places like FCR there’s plenty of casual social gathering around the fire pits in the evening, if you want company you can find it. Otherwise, if you’re a night owl like I am and have a vehicle, you have complete free reign of the place after the sun sets. Venture just out of town, you will not see another soul or vehicle until morning.
Nighttime is a big part of what makes this place so amazing. DV just recently got some special blah blah acknowledgements of being one of the darkest places in the northern hemisphere and I believe it. Bring binoculars, find a remote parking lot, lay down a blanket, and be amazed at the stars for hours. They’re very numerous and sharp, like lightbulbs on strings. The only thing you hear is the wind, the tinnitus in your ears, and maaaaybe some coyotes off in the distance. It doesn’t suck!
For an interesting experience I recommend driving out to Badwater (the lowest point in the basin, and North America for that matter) at night in the dead of summer. Even at midnight it’s still 111 F, virtually no wind/breeze, pitch black (save for stars/moon), dead silent, and nothing’s around for 20 miles. I think of it as the dry walk-in equivalent of a sensory deprivation tank as you walk around and are hugged by the warmness.
My DV travel tips, for going to/from the SF Bay:
Never been to Yosemite? Cut over the Sierras on highways 108 or 120, catch highway 395 south.
Going through Bakersfield and then over? Ignore your GPS telling you to take highway 178 (especially on the way back), it sucks. It’s a windy canyon highway and you’ll be stuck behind somebody riding the brakes all the way down at 45 mph.
Avoid shortcutting using the Trona/Wildrose road, it sucks. The road is not maintained well and patched all to hell. I discovered this at 1 am and was not pleased.
Those windy turns through the passes you take at night? Yeah, the darkness conceals you’re driving on the edge of a mountain with a 2000′ drop off on one side and there’s no guard rails.
Places like Panamint Springs, Stovepipe Wells, Furnace Creek are surprisingly far apart, 20-30 miles.
Get gas in Stovepipe Wells during the day. FC has 24/7 gas but it’s easily $1-$2/gallon higher than the rest of the world. Likewise since Panamint Springs is so remote and purely diesel generator powered, their gas is even higher; I think I saw $6.95/gallon this trip.
There’s AT&T EDGE coverage around Furnace Creek, but that’s it once you enter the park unless you get on a mountain top.
One thing I was amused by was hanging out in front of the FCR store and watching the tourist machine at work. The place seems to do a pretty good job processing bus loads of retirees. A big tour bus rolls in, stops at the curb and all of the passengers are herded up the steps into a big buffet room. An hour later the bus returns, everyone is herded back on the bus and driven the 0.25-0.50 mile back to the buildings with guest rooms. The bus door opens, they all again are herded into the same ground-floor unit to their rooms. Repeat the reverse the next morning, and then I guess they go off to their next tour destination or back to Vegas.
The after-hours crowd is what makes the ranch fun. The tourists and retirees usually clear out by 8 pm or so, and the night crowd starts trickling in (or continuing on) to the saloon or the fire pits in front of the store. What’s nice is that you don’t have to be a guest, any random person can come hang out. Pretty much everyone I chatted with are well traveled, come from all over, and have fascinating stories. Later on the employees get off shift and join in. Be nice to who cooked and served your cheeseburger, you will likely run into them here! Many seem to thrive on adventure too, lots of them are 20-somethings who signed up to work in national parks, traveling from park to park as they’re assigned.
While I was there I spotted a small fleet of Ford Focus and Fusion cars with Michigan manufacturer plates, all with dashes decked out in all sorts of digital readouts; I’m assuming GM product testing. Thursday night some sort of film crew rolled in from LA with several giant camper trailers, with some tall skinny girl with black hair and a clipboard buzzing around who was clearly running the show. As I left Friday morning I noticed the crew was apparently filming at the Old Borax Works, they had CHP present to block off the highway, trailers were set up on the parking lot, and people were huddled out on various hilltops. I have no idea what they were shooting, but I’d like to see it!
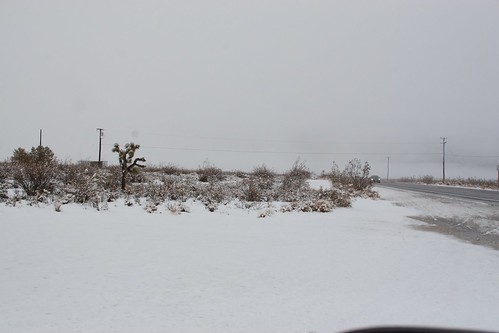
It was also sprinkling when I left Death Valley which was pretty nice and smelled amazing. What I didn’t realize is that this meant SNOW was waiting for me in the Sierras! Somewhere between Lone Pine and Bakersfield the sand on the side of the road turned to snow. Several inches had fell, the place was covered!
A couple of months ago I acquired a stack of Raspberry Pis because they were so hard to get, might as well get it over with. Of course, once I got them they went untouched for weeks. I eventually started selling off part of my stash to other coworkers to help spread the fun. After building the IKEA cluster using 10 mini-itx Atom boards in a HELMER cabinet, the next logical progression would be to build a Pi cluster. I began to wonder what one could even do with such a tiny rig (it’s fantastic for learning Chef or Puppet system automation), and half jokingly wondered if it could run Hadoop.
A Pi cluster is not new, people have done this before. Unfortunately it usually involves a gigantic stack of power strips and USB power adapters. I wanted to get rid of all of that and because I knew the Pi can be powered via USB or header, so I wired up a small power bus. Now, multiple Pis are powered by a standard Molex drive connector (which gives you 5V on the red/black wires) using a leftover ATX PSU. By my measurement, each Pi draws 400 mA, but I don’t know if/what the real limits are of the 5V output of the PSU though. It’s vague and hand-wavy, but I do know I haven’t yet burned my apartment down.
I had leftover IKEA HELMER drawers from the last project, which are basically 9.5″ wide, 4″ tall, and trimmed to 11″ deep. This perfectly fits 8-9 Raspberry Pis and a Netgear switch (PSU is elsewhere), but such a small switch only provides 8 switch ports with one of those ate for uplink, putting me at 7 RPis for my cluster. There doesn’t seem to be a compact 10/12/16 port switch that fits into the drawer so sadly some potential is lost.
The project wasn’t without setbacks, finding a simple way to mount them all took work. At first I tried stringing them up on pieces of coat hanger wire, but this was too flimsy to be of any use. The ethernet cabling wanted to pull everything around despite being zip-tied in place. I tried the threaded road approach this time. The holes in the board are really intended for fabrication and not mounting swears the RPi foundation, so nothing standard size fits through them. Finally in the back of the hardware store I found one 3′ piece of 4-40 (I think!) threaded rod that fit. It was a complete pain in the ass to thread 7 boards between a sandwich of nuts at the same time even with a drill to do the twisting, but the result was worth it after mounted in the drawer. The Pis are mounted solid and are eaaaaasy to work around now.
Low power draw: 7 boards, 2.8 amperes at 5 volt
Yes, if you blow one in the middle you’ll have to disassemble it to get it out, this happened to me before I started using the rod. The coat hanger solution was so shitty that somehow I shorted something and grey smoke rolled off a RPi. I took it out and later tested it, the little sucker STILL BOOTS. I have no idea what I fried on it, but they’re more resilient than I expected.
For power cabling, I used some breadboard jumper wires I had laying around. Cut them in half, the header plugs onto the RPi, other ends get soldered into a terminal. Instead of switches to power off individual RPis, I happened to have 3″ male/female jumpers which were perfect to loop up front to plug/unplug power conveniently. Alas I can’t get to the HDMI ports, I figured access to GPIO pins were more important.
Fry’s had a great sale the other day on 32 GB SDHC cards ($10!) so I maxed out most of the boards with storage. Ethernet is just a 1′ cat 5 (cat 6 is too stiff really) patch that’s looped and velcro’d in place.
All in all, the boards together draw 2.8 A at 5 VDC when running a UDP iperf test. The AC outlet meter continuously shows it drawing 30 W however, so I think this indicates overhead/inefficiency in the PSU. Best of all, it’s PERFECTLY SILENT. No fans, the heat it does give off is barely noticeable. It just sits there like this bizzaro computation toy, blinking away.
On to Hadoop!
Hadoop + HDFS + MapReduce
Why would you do such a silly thing? To see if it can be done!
I still run Raspbian on the boards, which is basically Debian 6. I haven’t had any particular problems building or getting normal packages to work on the RPi. It just works and cranks away like an old Celeron. There was doubt amongst others if Java would even work on them, be it memory consumption or ARM compatibility. The Raspbian distro includes OpenJDK which seems to work just fine.
Finally one night after I got all of the basic system Chef recipes ironed out I decided to just try installing Hadoop to see what would happen. In the course of my day job I don’t administer Hadoop infrastructure and only have a casual idea of how it all fits together, so it was all completely brand new to me. Being the impatient type I started rage googling and quickly found excellent tutorials on how to install Hadoop on single node and multi nodes by Michael Noll. The official Hadoop quick start guide seems sort of lacking in a few places, but his are complete and informative in the process. There were a few bumps, but nothing installing more packages or googling couldn’t solve quickly.
I think I got the cluster up and working with a couple of hours, start to finish, complete with HDFS. Get a single node working first, that’s 85% of the work done. The rest is stamping out the single node over and over X nodes, then updating the config to point at one NameNode. Even the included start-dfs script will take care of starting/stopping DataNode services on your slaves for you, so you only have to fiddle with the master.
HDFS write (730MB ISO file): 6 MB/sec read, 1.2 MB/sec write (5 minutes to copy an ISO to DFS, 2 minutes to copy back)
Getting MapReduce took some tuning because the default Java heap size is 1 G (ha!). Interestingly I was still able to run an example MR wordcount job from the tutorial on a single RPi with the default heap despite it swapping heavily and dropping some workers. After about 20 minutes later it finished and wrote its results. On the cluster however the example eventually failed after a long time, due to general memory starvation. Tuning the Java heap way down to 256 MB setting made the situation bearable, nodes could finally successfully finish small example MR jobs in a few minutes.
It’s amusing to note all this breaks the Hadoop best practices, going right down the list and snubbing every requirement. Tiny amounts of ram, slow I/O, slow network, slow everything. I guess the only thing going in performance’s favor is the fact that raw reads from SDHC are 10x faster than writes. Having said that, it’s all stock everything so performance can only get better if one really wanted to crawl all over it. In the end it’s still a good exercise in learning how something new works!
It remains to be seen if I keep the RPis in this configuration, or I swap them out later with Cubieboards. Either way, the form factor means it can be inserted into the IKEA cluster cabinet for some “yo dawg I heard you like clusters…” action.
EDIT: MapReduce example with ‘wordcount’:
MapReduce is pretty painful. Here I’m running a MR wordcount job using 2,098,367 bytes (!) of plain text as input … 10 minutes and 32 seconds later the job completes.
hduser@rpi01:/opt/hadoop$ time bin/hadoop jar hadoop*examples*.jar wordcount /user/hduser/txt /user/hduser/txt-out1115
13/03/13 07:20:53 INFO input.FileInputFormat: Total input paths to process : 2
13/03/13 07:20:54 WARN util.NativeCodeLoader: Unable to load native-hadoop library for your platform... using builtin-java classes where applicable
13/03/13 07:20:54 WARN snappy.LoadSnappy: Snappy native library not loaded
13/03/13 07:21:02 INFO mapred.JobClient: Running job: job_201303130634_0003
13/03/13 07:21:03 INFO mapred.JobClient: map 0% reduce 0%
13/03/13 07:22:36 INFO mapred.JobClient: map 1% reduce 0%
13/03/13 07:22:40 INFO mapred.JobClient: map 2% reduce 0%
...
13/03/13 07:26:38 INFO mapred.JobClient: map 98% reduce 16%
13/03/13 07:26:42 INFO mapred.JobClient: map 99% reduce 16%
13/03/13 07:26:47 INFO mapred.JobClient: map 100% reduce 16%
13/03/13 07:28:50 INFO mapred.JobClient: map 100% reduce 33%
...
13/03/13 07:30:02 INFO mapred.JobClient: map 100% reduce 100%
13/03/13 07:30:59 INFO mapred.JobClient: Job complete: job_201303130634_0003
13/03/13 07:30:59 INFO mapred.JobClient: Counters: 30
13/03/13 07:30:59 INFO mapred.JobClient: Job Counters
13/03/13 07:30:59 INFO mapred.JobClient: Launched reduce tasks=1
13/03/13 07:30:59 INFO mapred.JobClient: SLOTS_MILLIS_MAPS=741642
13/03/13 07:30:59 INFO mapred.JobClient: Total time spent by all reduces waiting after reserving slots (ms)=0
13/03/13 07:30:59 INFO mapred.JobClient: Total time spent by all maps waiting after reserving slots (ms)=0
13/03/13 07:30:59 INFO mapred.JobClient: Rack-local map tasks=1
13/03/13 07:30:59 INFO mapred.JobClient: Launched map tasks=3
13/03/13 07:30:59 INFO mapred.JobClient: Data-local map tasks=2
13/03/13 07:30:59 INFO mapred.JobClient: SLOTS_MILLIS_REDUCES=276932
13/03/13 07:30:59 INFO mapred.JobClient: File Output Format Counters
13/03/13 07:30:59 INFO mapred.JobClient: Bytes Written=470902
13/03/13 07:30:59 INFO mapred.JobClient: FileSystemCounters
13/03/13 07:30:59 INFO mapred.JobClient: FILE_BYTES_READ=733821
13/03/13 07:30:59 INFO mapred.JobClient: HDFS_BYTES_READ=2098588
13/03/13 07:30:59 INFO mapred.JobClient: FILE_BYTES_WRITTEN=1539326
13/03/13 07:30:59 INFO mapred.JobClient: HDFS_BYTES_WRITTEN=470902
13/03/13 07:30:59 INFO mapred.JobClient: File Input Format Counters
13/03/13 07:30:59 INFO mapred.JobClient: Bytes Read=2098367
13/03/13 07:30:59 INFO mapred.JobClient: Map-Reduce Framework
13/03/13 07:30:59 INFO mapred.JobClient: Map output materialized bytes=733827
13/03/13 07:30:59 INFO mapred.JobClient: Map input records=44877
13/03/13 07:30:59 INFO mapred.JobClient: Reduce shuffle bytes=733827
13/03/13 07:30:59 INFO mapred.JobClient: Spilled Records=102008
13/03/13 07:30:59 INFO mapred.JobClient: Map output bytes=3474212
13/03/13 07:30:59 INFO mapred.JobClient: CPU time spent (ms)=518320
13/03/13 07:30:59 INFO mapred.JobClient: Total committed heap usage (bytes)=413401088
13/03/13 07:30:59 INFO mapred.JobClient: Combine input records=361196
13/03/13 07:30:59 INFO mapred.JobClient: SPLIT_RAW_BYTES=221
13/03/13 07:30:59 INFO mapred.JobClient: Reduce input records=51004
13/03/13 07:30:59 INFO mapred.JobClient: Reduce input groups=44447
13/03/13 07:30:59 INFO mapred.JobClient: Combine output records=51004
13/03/13 07:30:59 INFO mapred.JobClient: Physical memory (bytes) snapshot=397709312
13/03/13 07:30:59 INFO mapred.JobClient: Reduce output records=44447
13/03/13 07:30:59 INFO mapred.JobClient: Virtual memory (bytes) snapshot=1056927744
13/03/13 07:30:59 INFO mapred.JobClient: Map output records=361196

real 10m32.817s
user 0m32.830s
sys 0m1.950s
It’s been fantastically warm this weekend for once, enough to get me outside long enough to notice my plants have started budding/flowering! The pink jasmine, lavender, and this succulent are all showing signs of new life.
I’m taking a couple of weeks of vacation soon, which will be awesome. I don’t have many ideas on what I want to do; I at least want to go to Death Valley for a couple of days, then visit a friend.
I’m in a quasi-contemplative mood (and sick with a cold) and I wanted to add my own version to go with all of the 2012-in-review stories I keep seeing on the news. To be honest, 2012 has been an exercise in existence and not so much actual living.
The good:
After basically a decade of yearning I finally live in the San Francisco Bay Area. As a diehard tech person this has been the hot spot where all the exciting things happen. For years I freaked out and balked at the cost of living, not knowing if I’d be able to get a job to afford it all on my own without roommates. I finally made it (by way of Seattle) at the start of 2012!
I got the job of my dreams. This one was tough. As an engineer, I really can’t ask for a better place to work. I’m free to really crank on interesting things without all the distractions such as phone calls, angry customers, office politics, incompetent coworkers/groups. Every single person I work with is brilliant and they’re always willing to help out.
I’m out of Washington. It’s no secret I hated it there, it just wasn’t for me.
I adopted Charlie, my 2nd tuxedo cat.
I discovered microelectronics aren’t as hard as I expected; I also discovered homemade drones which has lit my imagination on fire.
I love California, I wish I had moved here years ago. (I’ll secretly admit I even like it more than Texas.) It’s oddly hard to fly somewhere else now, I don’t want to leave!
The bad:
I let my heart be broken in a big way and it continues to hurt. For months and months I would wake up angry at myself for getting into such a situation, yet I knew full well ahead of time what the risks were. On one hand it’s fascinating to see how powerful brain chemistry is, on the other hand it’s a real bitch.
I swam through the weeks. At some point I didn’t even care if I blew a Friday night because I knew another one would be here before I knew it. While this made the weekends come fast it also made the months tick by, everything was a blur. I can’t tell you what I did a week ago, let alone three months ago.
I had a head-on collision with tech burnout and the wreckage is still smoldering. I’m flat out sick of tech right now. I don’t even want to hack on my home projects, I’d rather go for a hike or drive along the coast. There are many causes but primarily I just didn’t step away enough.
I’ve made zero friends outside of work. For a large part of the year I would be so exhausted when I got home, I just didn’t want to deal with people or go out at all. I became very anti-social (which is a huge irony considering where I work).
Didn’t visit my family in Oklahoma or friends in Texas at all, other than the family at Thanksgiving and Christmas.
For 2013, I need to get my house in order. Before I walked out the door this morning some televangelist on the telly said something that stuck with me (paraphrasing): “If you’re not enthusiastic and living your life, you’re just existing”. I strongly feel I spent all this year just existing, waiting for something to happen; waiting to get through another busy day; waiting for the weekend so I could decompress and sleep.
Despite how anti-social and a hermit I’ve become, I need to make a point to get out to meet people (starting with a party I was invited to on NYE). I need to get involved with or re-discover non-tech hobbies (cooking?, lock picking?) and go on real vacations even if I have to go alone.
I finally got proficient enough at work that I stopped with the weekend studying and hacking, which is finally helping me want to step outside to explore. I often forget things like Merritt Lake are just 15 minutes away via BART, Santa Cruz is ~40 minutes away, the coast is ~30 minutes away. All this awesome California stuff around me that I never think about because I just wanted to stay home.
I just want to be normal and enthusiastic about life, I hope I can accomplish this in 2013.
 I recently started using Ubiquiti’s EdgeRouter Lite to replace the routing functionality of my Airport Extreme at home and for some other networking projects. I really like this little box, $99 gets you a 3-port gigabit router and it can really churn through packets. It runs EdgeOS, which is based upon Debian along with the Vyatta routing stack.
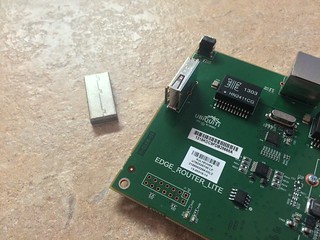 A few other people have been hacking on EdgeRouters, even getting FreeBSD running on them. I was most surprised by internal flash storage being just a removable USB thumb drive sitting in a socket on the board. It has a 2 GB stick in it, which should easily be replaceable by something larger if so desired. The U-Boot bootloader is over in another piece of flash on the board.
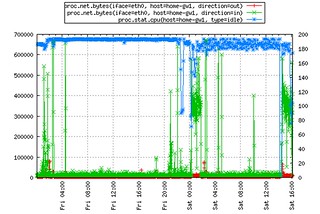


