
Yes! Web-scale home electricity tracking, because why not!
For the longest time I’ve been using the Kill-A-Watt meter to measure home power usage, especially all of my computer gear. The problem is, you only get a LCD readout, no way to store that info over time. A friend told me how he was using Insteon (basically X10 home automation that doesn’t suck) kit at home and they had an iMeter device that would collect power usage which you could download via an Ethernet-based Insteon SmartLinc controller. Each iMeter cost about $35 and the 2412N controller was about $90. Spendy if you want to measure just one thing, but it’s certainly way cheaper than any of the alternatives. I bought a set to put on my desktop computers and IKEA cluster.
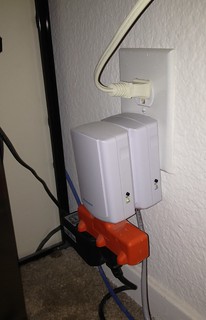
Insteon iMeter and 2412N controller
The Insteon controller has a web server built into it with a basic but functional interface; same for the iPhone app. The client lets you control various Insteon devices or display the watt reading from a single iMeter. Unfortunately the 2412N controller I have doesn’t store values it collects. After examining the JavaScript the web UI uses and some tcpdumps, I was able to pick apart the commands the client makes over HTTP to get data from the meters. Each Insteon device has a six-digit hex ID such as 19.84.17 written on the back, which in the case of multiple iMeters is used to reference a particular one.
A request is made to the controller with a GET request with a request string like /3?02621984170F8200=I=3, then another request for /buffstatus.xml fetches the result of the request. In this case:
- 0262 is basically “here comes a raw command”
- 198417 is the ID of the iMeter
- 82 is “get iMeter status”
- 00 is a do not care byte, and the rest is trailing info.
Given the Insteon IDs of each iMeter, it’s possible to fetch the wattage readings from them via HTTP. Here is an Insteon developer PDF that describe the various request and response fields.
A command-line example:
[bwann@lapdance ~]$ GET http://smartlinc01/3?02621984170F8200=I=3 ; GET http://smartlinc01/buffstatus.xml
<response><BS>02621988140F82000602501988141E50C42B820002511988141E50C41B820000D201050180009A00097D207DD5</BS></response>
The response is a long string of text fields that contain various things as the remote device id, command sent, low+high bytes for counters of current and total watts used.
I incorporated this into a small python script to handle all the munging and parsing for me. (‘GET‘, by the way, along with ‘POST‘ and ‘HEAD‘ are part of the perl-libwww-perl package and is awesome when you want to quickly run a particular HTTP command without typing it out by hand in telnet).
For the TL;DR of the python code, head over to GitHub where I’ve implemented iMeter collection into a database collection script: smartlinc_imeter.py
Great, now how to collect and graph it?
OpenTSDB
All this year I’ve been playing with the OpenTSDB time series database (which you should really check out) at home to gather server statistics and really love how trivial it makes adding and collecting new metrics. Come up with a string of value+timestamp+counter and optional key=value tags, shoot it over to a TCP socket, and you’re done. Plug in the same metric name into the TSD web interface, and boom, there’s your charts. Way, way, way better than the old song and dance of RRD and whipping up the ubiquitous not-so-simple shell script to store+graph just one damn metric. (Okay, it is a bit more complicated to get started with than that in that now you’re running HBase as the backend, but it’s designed to handle billions of data points a day, it’s easy to get started with and totally worth it. Very fast means it’s a pleasure to work with your datasets. The awesomeness of OpenTSDB is a whole ‘nother post.)
OpenTSDB uses a set of simple tcollector scripts that run on systems and upload various data such as cpu/disk/io usage, and whatnot every 15 seconds. The set of tcollector scripts that come with OpenTSDB on GitHub are actually very well written and simple. Because you can send data to TSD over a TCP request it makes collectors very easy to implement. Even one line shell scripts such as “echo blah | nc 4242” work just fine. It lends itself to rapidly letting you invent new collectors to get new metrics you’re interested in. If you’ve ever used Nagios or MRTG, you’ve surely experienced plug-in hell where somebody has gobbed together 50 lines of perl to ultimately run a single command with system() to get one value. Another nice benefit of the tcollector setup, it automatically re-starts a collector script if one dies or you add a new one, something you normally have to deal with on your own.
I wrote a tcollector script in python that would query the Insteon SmartLinc controller every 15 seconds and request data on the various iMeters in my apartment, parse the results, and then upload the values to TSD. I have two metric names insteon.imeter.watt and insteon.imeter.total, tagged with the device ID. Using this I can now generate charts that refresh every 15 seconds to show me the latest power usage! If I ever add another iMeter or other controllers, I just drop in one line into a config file with the new device ID/IP and it automatically picks it up and the data are immediately available in the chart UI.
[root@basic07 0]# python ./smartlinc_imeter.py
insteon.imeter.watt 1382596852 210 controller=smartlinc01.wann.net device=198687
insteon.imeter.total 1382596852 5464099 controller=smartlinc01.wann.net device=198687
insteon.imeter.watt 1382596852 206 controller=smartlinc01.wann.net device=198814
insteon.imeter.total 1382596852 550299 controller=smartlinc01.wann.net device=198814
The tcollector script is over on Github, and the comments include my notes on how to parse the Insteon commands and requests.
- smartlinc_imeter.py
- SmartHome forum thread where I gleamed some protocol information
- iMeter developer reference