All photos over on Flickr.
 Saturday, Aug 21: It wasn’t until I was laying on the toolbox of my truck gazing at the stars from the side of the road that I realized I found a solitude I hadn’t been looking for. Up until now I was tired from driving all day, a bit gloomy from getting a pair of traffic citations (speeding + expired tags) on my trip and the weather still being too cloudy+stormy to do night photography & camp in Big Bend. Plus I couldn’t decide if I wanted to stay the night somewhere or start home. I had all this on my mind as I drove north of Marathon, and I just thought “damn it, stop it, stop right here.” I pulled off to ponder at some turnoff on highway 385 and noticed the sky had cleared up. I set up the camera pointing at Polaris and laid down on my sleeping bag. All of a sudden, all worries and the concerns of what to do completely disappeared and it was very peaceful.
For being a main highway between Marathon and Fort Stockton, it was a very quiet place. For the three hours I was taking photos, only three cars passed by. There was a strong breeze that really cooled things down, to the point I needed to be in the sleeping bag. Nearby I could occasionally hear packs of coyotes howling at each other. The moon was pretty bright, giving the land a white glow. Unfortunately this glow made the star photography hard, despite fiddling with exposure settings the moon was just too bright. I saw several bright green meteoroids burn up (Leonid?) and a few faint satellites pass. Firing up a constellation app on the iPad, I learned & saw where Cassiopeia was for the first time! It was so nice here I decided to just spend the night on this little turnoff, and hope nobody stopped to bug me.
This day started by waking up at a rest stop on I-10 near Ozona, having gotten pulled over the night before on the way out. I wanted to visit Big Bend again, but wasn’t sure where I wanted to go. In Marathon I pulled over at a little visitor information center. Thumbing through a random travel guide, a statement caught my eye:
“Highway 170 between Presidio and Lajitas, was designated by National Geographic as one of the most scenic drives in North America”
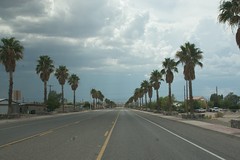 I knew this was exactly where I wanted to go, so I headed over through Alpine and Marfa and down to Presidio. On the way there I brushed with a thunderstorm and got to see a lightning show off on the distance. The temperature swung greatly from 100 F to 75 within the storm and back to 107 when I got to Presidio. This is a odd town to me. One fork in the road leads to the Mexico border, the other leads to the main street. It’s very hot, lots of shoddy gravel lots and junked up trailerhouses.
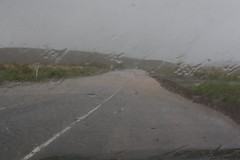 As soon as I left Presidio on FM 170 I ran right into the middle of the thunderstorm. The highway was underwater in places due to flash flooding. I was in a downpour, getting hit by little hail occasionally and the wind was very gusty. Basketball sized rocks were washing off the side of hills into the roadway. I was afraid there would be no scenic viewing on this trip, but after a few miles I was able to push to the other side of the storm and it was clear again.
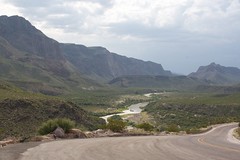 FM 170 really is a great scenic road. It’s endless dips and in very good condition. It runs right along the Rio Grande, up a few hills, and surrounded by canyons and large mesas. Mexico is often just a few meters away. There’s even the leftovers of a movie set from Uphill All the Way that I wandered about. It was kinda sketchy when I saw fairly fresh footprints in mud on the riverbank. I imagined illegals or drug mules hiding out in these prop buildings, and I was unarmed 20 miles from anywhere, so I left. Back on the road I stopped top of the tallest hill to take photographs. While I was there the wind kicked up and I was being sandblasted by little particles and rocks as I walked around. Afterward I wiped my brow and noticed I was completely covered in sand. Fortunately, this was the last of the freak weather I encountered.
Lajitas is another odd town on 170. There’s a nice looking hotel and the “Lajitas Boardwalk”, this little strip of well kept stores that looks completely abandoned. At the other end of town is a general store, a fire department and the town hall. That’s it. I’m not even sure I saw any homes!
From there I traveled into Terlingua/Study Butte and onward to Big Bend. I drove through the park to the Chisos Mountain Basin area. I had no idea there were campgrounds, a general store and a little motel here. It is a really nice area! The sun was almost down, and the storm was beginning to catch up with me. It was cloudy and cooled off again. You’d see lightning and it would make this wonderful thundering sound as it bounced around in the mountains around the basin. Otherwise it was completely quiet. This area also serves as trail heads for several peak trails, including to the tallest in Big Bend, Emory Peak.
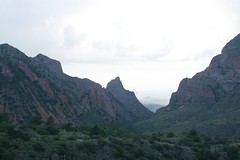 At the southwest end of the basin is a giant notch called “The Window” where the basin drains. There’s a great little trail from the parking lot out to a viewing area where you can just sit and look at the canyon. You really couldn’t go wrong here, everything in this area had a great view of it. There were plenty of chairs and picnic tables, plus many of the lodge rooms faced it. A side note, the room rates are pretty steep ($100+) and spartan (no tubs, no A/C in some), but if you just want a place to collapse and shower after hiking, they’re perfect. I’d probably recommend it, I definitely recommend the location.
Because of the impending storms, lack of rain gear, and it being too cloudy to see stars I decided to leave Big Bend. When I got to Marathon I hadn’t decided what I wanted to do and had my crisis of choices which lead to stargazing.
 Sunday, Aug 22: I woke up at 10 AM to a warm breeze blowing through the windows of the truck. I survived the night without getting robbed and murdered or having any visitors. It was still quiet, I remember hearing only two cars pass by as I was waking up. I was hungry and went back to Marathon in search of food. I actually recall seeing a few places to eat, but there was one, Marathon Coffee Shop that had a little crowd on the front porch that gave it life. I had a turkey sandwich and coffee (serve yourself), both were great. On the counter was a large pickle jar as a “Texas sized” tip jar that made me lolz. There was a postcard rack with a cute sign chastising e-mail by saying there’s nothing more precious than a handwritten note. I of course was sitting there uploading photos to my iPad. The camera kit, btw, is a great add-on.
After I finished lunch, I decided I didn’t want to get home so early so I sat out to wander. Against what I didn’t want to do last night, I drove back into Alpine for no reason. I took a few photographs and hit up Sonic. The weather was so lovely, clear, and moderately warm. It was fantastic to have the windows rolled down and listening to the stereo the whole way home.
Despite the fuss I make of not wanting to go home at nights, it certainly feels nice right now to shower and sit down. I think if I do this again, I need to find some better constellation and satellite tracker apps for my iPad+iPhone. The random free one I installed was certainly instantly useful and helped me find Cassiopeia, but kind of annoying to use. I never was a Boy Scout nor finished Astronomy in college, so I have no idea what I’m looking at at night and want to know!
Tags: roadtrip


